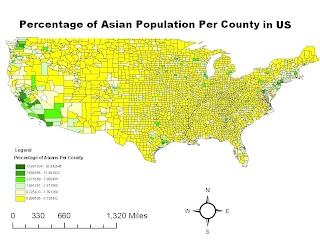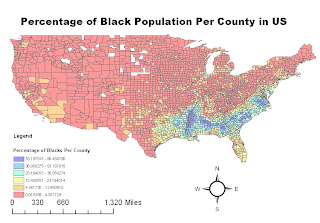
This map above shows the population density of Asians in the United States according the census in the year 2000. As we can see from the map, there are not a lot of Asians that live in the middle portion of the United States, most of them live on the West Coast, however, there are a few states with a high density of Asians on the East Coast as well. The counties with high Asian population density are often clustered together. Also from this map we see that the county with the highest Asian population density is in California, with 30.84 percent. This could be due to the recent high migration patterns of Asians, and since the coast is the most accessible places to arrive, that is where they choose to live. Also, the coastal cities are where the metropolitans are, therefore there is a mixture of different races of people. This map shows the population density of Blacks in the counties of United States. This information is also obtained from the Census in the year 2000. As we can see from this map, the counties with the highest density of Blacks is in the South-eastern part of the United States. The pattern is interesting because there is a whole section of these counties with high population density of Blacks. It is all concentrated within this area near the Mississippi, while everywhere else in the US, there is not a high population density of Blacks. Also from this map we see that the county with the highest percentage of Blacks in its population density has a percentage of 86.49. That is a very high percentage, meaning the overall majority of that specific county is made up of Blacks. Since most of the Blacks are concentrated within the same area, we can infer from this map that they like to stay together in one area.
 This map shows the population density of Blacks in the counties of United States. This information is also obtained from the Census in the year 2000. As we can see from this map, the counties with the highest density of Blacks is in the South-eastern part of the United States. The pattern is interesting because there is a whole section of these counties with high population density of Blacks. It is all concentrated within this area near the Mississippi, while everywhere else in the US, there is not a high population density of Blacks. Also from this map we see that the county with the highest percentage of Blacks in its population density has a percentage of 86.49. That is a very high percentage, meaning the overall majority of that specific county is made up of Blacks. Since most of the Blacks are concentrated within the same area, we can infer from this map that they like to stay together in one area.
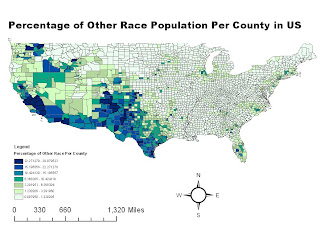
  The last map shows the population density of other races in the US. Clearly, the places with high population density of other races are mostly on the West Coast. It is interesting to see this distinct pattern between the east and west from this map. Almost all of the counties with a high density of other races are clustered together. Although almost all the states on the West Coast have a higher density of other races than the East Coast, it is visible that states in the South have a higher density than states in the North. From this map, we can infer that the western part of the US has a higher racial diversity than the eastern part.
 I enjoyed doing this lab because it combined all of the things we learned in this class. The tutorial taught us how to incorporate different elements into the map and how to make it look appealing visually. Overall, these maps were useful in showing the ethnic population in the United States. We can see how there is a clear pattern that certain races like to reside in certain areas. Many Asians live on the West Coast since most of them migrated to California during the Gold Rush and the construction of the Transcontinental Railroad. Many Blacks live in the Southern part due to the historical impact of slavery. And since the western part of the US is newer than the eastern side, it has more ethnic diversity. This lab showed how we can use GIS in many aspects and for many purposes. For this lab, we used data from the US Census Bureau to show the ethnic diversity in the United States. Sociologists can use this map to analyze racial distribution in the US.
My overall impression of GIS is that it is very useful in our everyday lives and it is a very interesting class. From this class, I learned how we use GIS in our everyday lives, like when we use Google Maps for directions or when we look at mash-ups of our favorite stores. The part that I did not like about this class was that a lot of the information was new to me, so it was actually pretty difficult. I am sure that most of the students taking this class are actually not Geography majors, but taking this class for a GE. Therefore, most of the terms were new to me and these labs were confusing at times. It got frustrating when I often had to stay in lab for over three hours to finish my lab. Although I will probably never learn more about GIS, I am now more aware of my spatial surroundings. This blog will always be a memory of this class and maybe in 10 or 20 years I'll come back and look at this and be amazed at all the interesting maps I have created.
Thank you Lindsay for always helping me out in lab! :)


 14. What is the magnetic declination of the map?